#4. Hammer Candlestick Pattern |
Channel: Mahendra kori
Category: Education
Tags: stock trading coursehammer candle in hindicandlestickwhat is hammer candlestickcandlestick patternhammer candlestick in hindihammer candlestick patterncandlestick analysishammer candlecandlestick patterns in hinditechnical analysishammer candlestickhammer candlestick pattern meaninghammer candlestick trading strategy in hindihammer candlestick pattern in hindicandlestick patternswhat is hammer candle patternmahendra kori
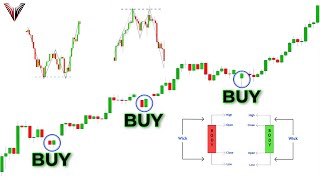
Description: Candlestick Pattern Playlist link:- youtube.com/c/Mahendrakori/playlists A hammer is a price pattern in candlestick charting that occurs when a security trades significantly lower than its opening, but rallies within the period to close near the opening price. This pattern forms a hammer-shaped candlestick, in which the lower shadow is at least twice the size of the real body. The body of the candlestick represents the difference between the open and closing prices, while the shadow shows the high and low prices for the period. A hammer occurs after the price of a security has been declining, suggesting the market is attempting to determine a bottom. Hammers signal a potential capitulation by sellers to form a bottom, accompanied by a price rise to indicate a potential reversal in price direction. This happens all during a single period, where the price falls after the opening but then regroups to close near the opening price. Hammers are most effective when they are preceded by at least three or more declining candles. A declining candle is one that closes lower than the close of the candle before it. A hammer should look similar to a "T". This indicates the potential for a hammer candle. A hammer candlestick does not indicate a price reversal to the upside until it is confirmed. Confirmation occurs if the candle following the hammer closes above the closing price of the hammer. Ideally, this confirmation candle shows strong buying. Candlestick traders will typically look to enter long positions or exit short positions during or after the confirmation candle. For those taking new long positions, a stop loss can be placed below the low of the hammer's shadow. Hammers aren't usually used in isolation, even with confirmation. Traders typically utilize price or trend analysis, or technical indicators to further confirm candlestick patterns. Hammers occur on all time frames, including one-minute charts, daily charts, and weekly charts. Copyright Disclaimer: - Some contents are used for educational purposes under fair use. Copyright Disclaimer under Section 107 of the Copyright Act 1976, allowance is made for "fair use" for purposes such as criticism, comment, news reporting, teaching, scholarship, and research. Fair use is a use permitted by copyright statutes that might otherwise be infringing. Non-profit, educational, or personal use tips the balance in favor of fair use. 00:00 First Part? 00:37 What is a Hammer Candlestick Pattern? 03:58 Hammer candle on the actual chart? 06:10 Hammer candle on 2nd chart 09:08 Hammer candle on 3rd chart